

OpenStack
Why High Availability Doesn't Guarantee Resilience
Learn why high availability doesn't guarantee resilience and how failure domains, redundancy, and failover testing help prevent outages.
Read field noteField notes / Latest
Engineering notes from operating open infrastructure: the failures, design decisions, and upstream work that make open infrastructure better.
Browse all field notesLearn why high availability doesn't guarantee resilience and how failure domains, redundancy, and failover testing help prevent outages.
Read field note
VEXXHOST attended the ALL IN reception at Scale AI in Montréal, held alongside the Canada–EU Summit, highlighting AI innovation and technology cooperation.
Read field note
Learn why detecting infrastructure problems is easier than finding their causes, and how monitoring and troubleshooting can improve diagnosis.
Read field note
Size a self-hosted observability stack from your own Prometheus series and Loki log bytes, then price it against a hosted vendor at equal retention.
A self-hosted observability stack is a set of stateful services that page you about themselves: Prometheus and a long-term metrics store, Loki for logs, Tempo for traces, Grafana on top, and a collector on every node. When that pipeline fails in the middle of an outage, the engineers chasing the outage also have to repair their tools. A team that cannot staff an on-call rotation for the pipeline should usually pay a vendor. For scale, Google's SRE book derives eight engineers as the minimum single-site team for a 24/7 rotation with a primary and a secondary on call and no engineer spending more than 25% of their time on call (Being On-Call). Your own policy may differ. Count the people before you count the disks. Use the same measured production volumes and retention requirements to compare the operating models, then size and price each chosen architecture.
Three operating models come up, and each draws the billing and on-call boundary in a different place:
A vendor wins when you cannot staff the rotation, or when its quote at your measured volume costs less than the engineering time priced in the last section. Grafana Labs, which maintains Loki, Mimir and Tempo, sells hosted versions as Grafana Cloud. If your main query is free-text search across log bodies, Loki scans chunks to answer it, while OpenSearch and Elasticsearch index the log text itself and answer from that index, at the price of more index storage to operate.
Self-hosting wins when telemetry must stay in infrastructure and a jurisdiction you control, or when you already operate object storage and the quote at your volume exceeds what the rotation would cost. For the same decision one layer down, at the cloud itself, read managed vs self-managed on-premise cloud.
For a team already self-hosting, these are signs the stack has outgrown the people running it:
Grafana Labs calls Loki, Grafana, Tempo and Mimir together the LGTM stack. Here is what each component stores or does, with the versions used for the source checks:
Two deployment modes are assumed throughout: Tempo in monolithic mode and Mimir in its classic architecture. Both are explained below.
Prometheus's storage docs say local storage "is not clustered or replicated" and should be managed "like any other single node database". Loki does not index log contents. Tempo describes itself as "requiring only object storage to operate" (README). That holds for monolithic mode. In 3.0.3, microservices mode "requires a Kafka-compatible system, such as Apache Kafka, Redpanda, or WarpStream" between the distributor and downstream components, and compaction block_retention defaults to 336h (configuration).
Every unique combination of metric name and label values is a series, and the head block holding current samples lives in memory. A label carrying user IDs, request paths or pod UIDs multiplies series. Drop it in the service, or at scrape time with metric_relabel_configs. The storage docs add that "reducing the number of series is likely more effective" than a longer scrape interval, "due to compression of samples within a series."
# Series per metric name, top 10. Expensive: run once, off-peak.
topk(10, count by (__name__) ({__name__=~".+"}))

# Series in the head block, and samples ingested per second
prometheus_tsdb_head_series
sum(rate(prometheus_tsdb_head_samples_appended_total[1h]))
The TSDB status endpoint returns head stats and the top metrics and labels by cardinality, and promtool tsdb analyze reports churn, label pair cardinality and compaction efficiency for the last persisted block (promtool). The upstream image ships promtool and keeps data in /prometheus.
curl -s 'http://prometheus.example.internal:9090/api/v1/status/tsdb?limit=20' \
  | jq '.data.headStats, .data.seriesCountByMetricName, .data.labelValueCountByLabelName'

promtool tsdb analyze --limit=20 /prometheus
limit defaults to 10 items; 3.14.0 rejects values above 10,000, and 2.51.2 already accepts the parameter (2.51.2 API). Exceeding a scrape's sample_limit or label_limit (both default 0, no limit) fails the whole scrape (configuration), so set them above today's peak and alert on failed scrapes.
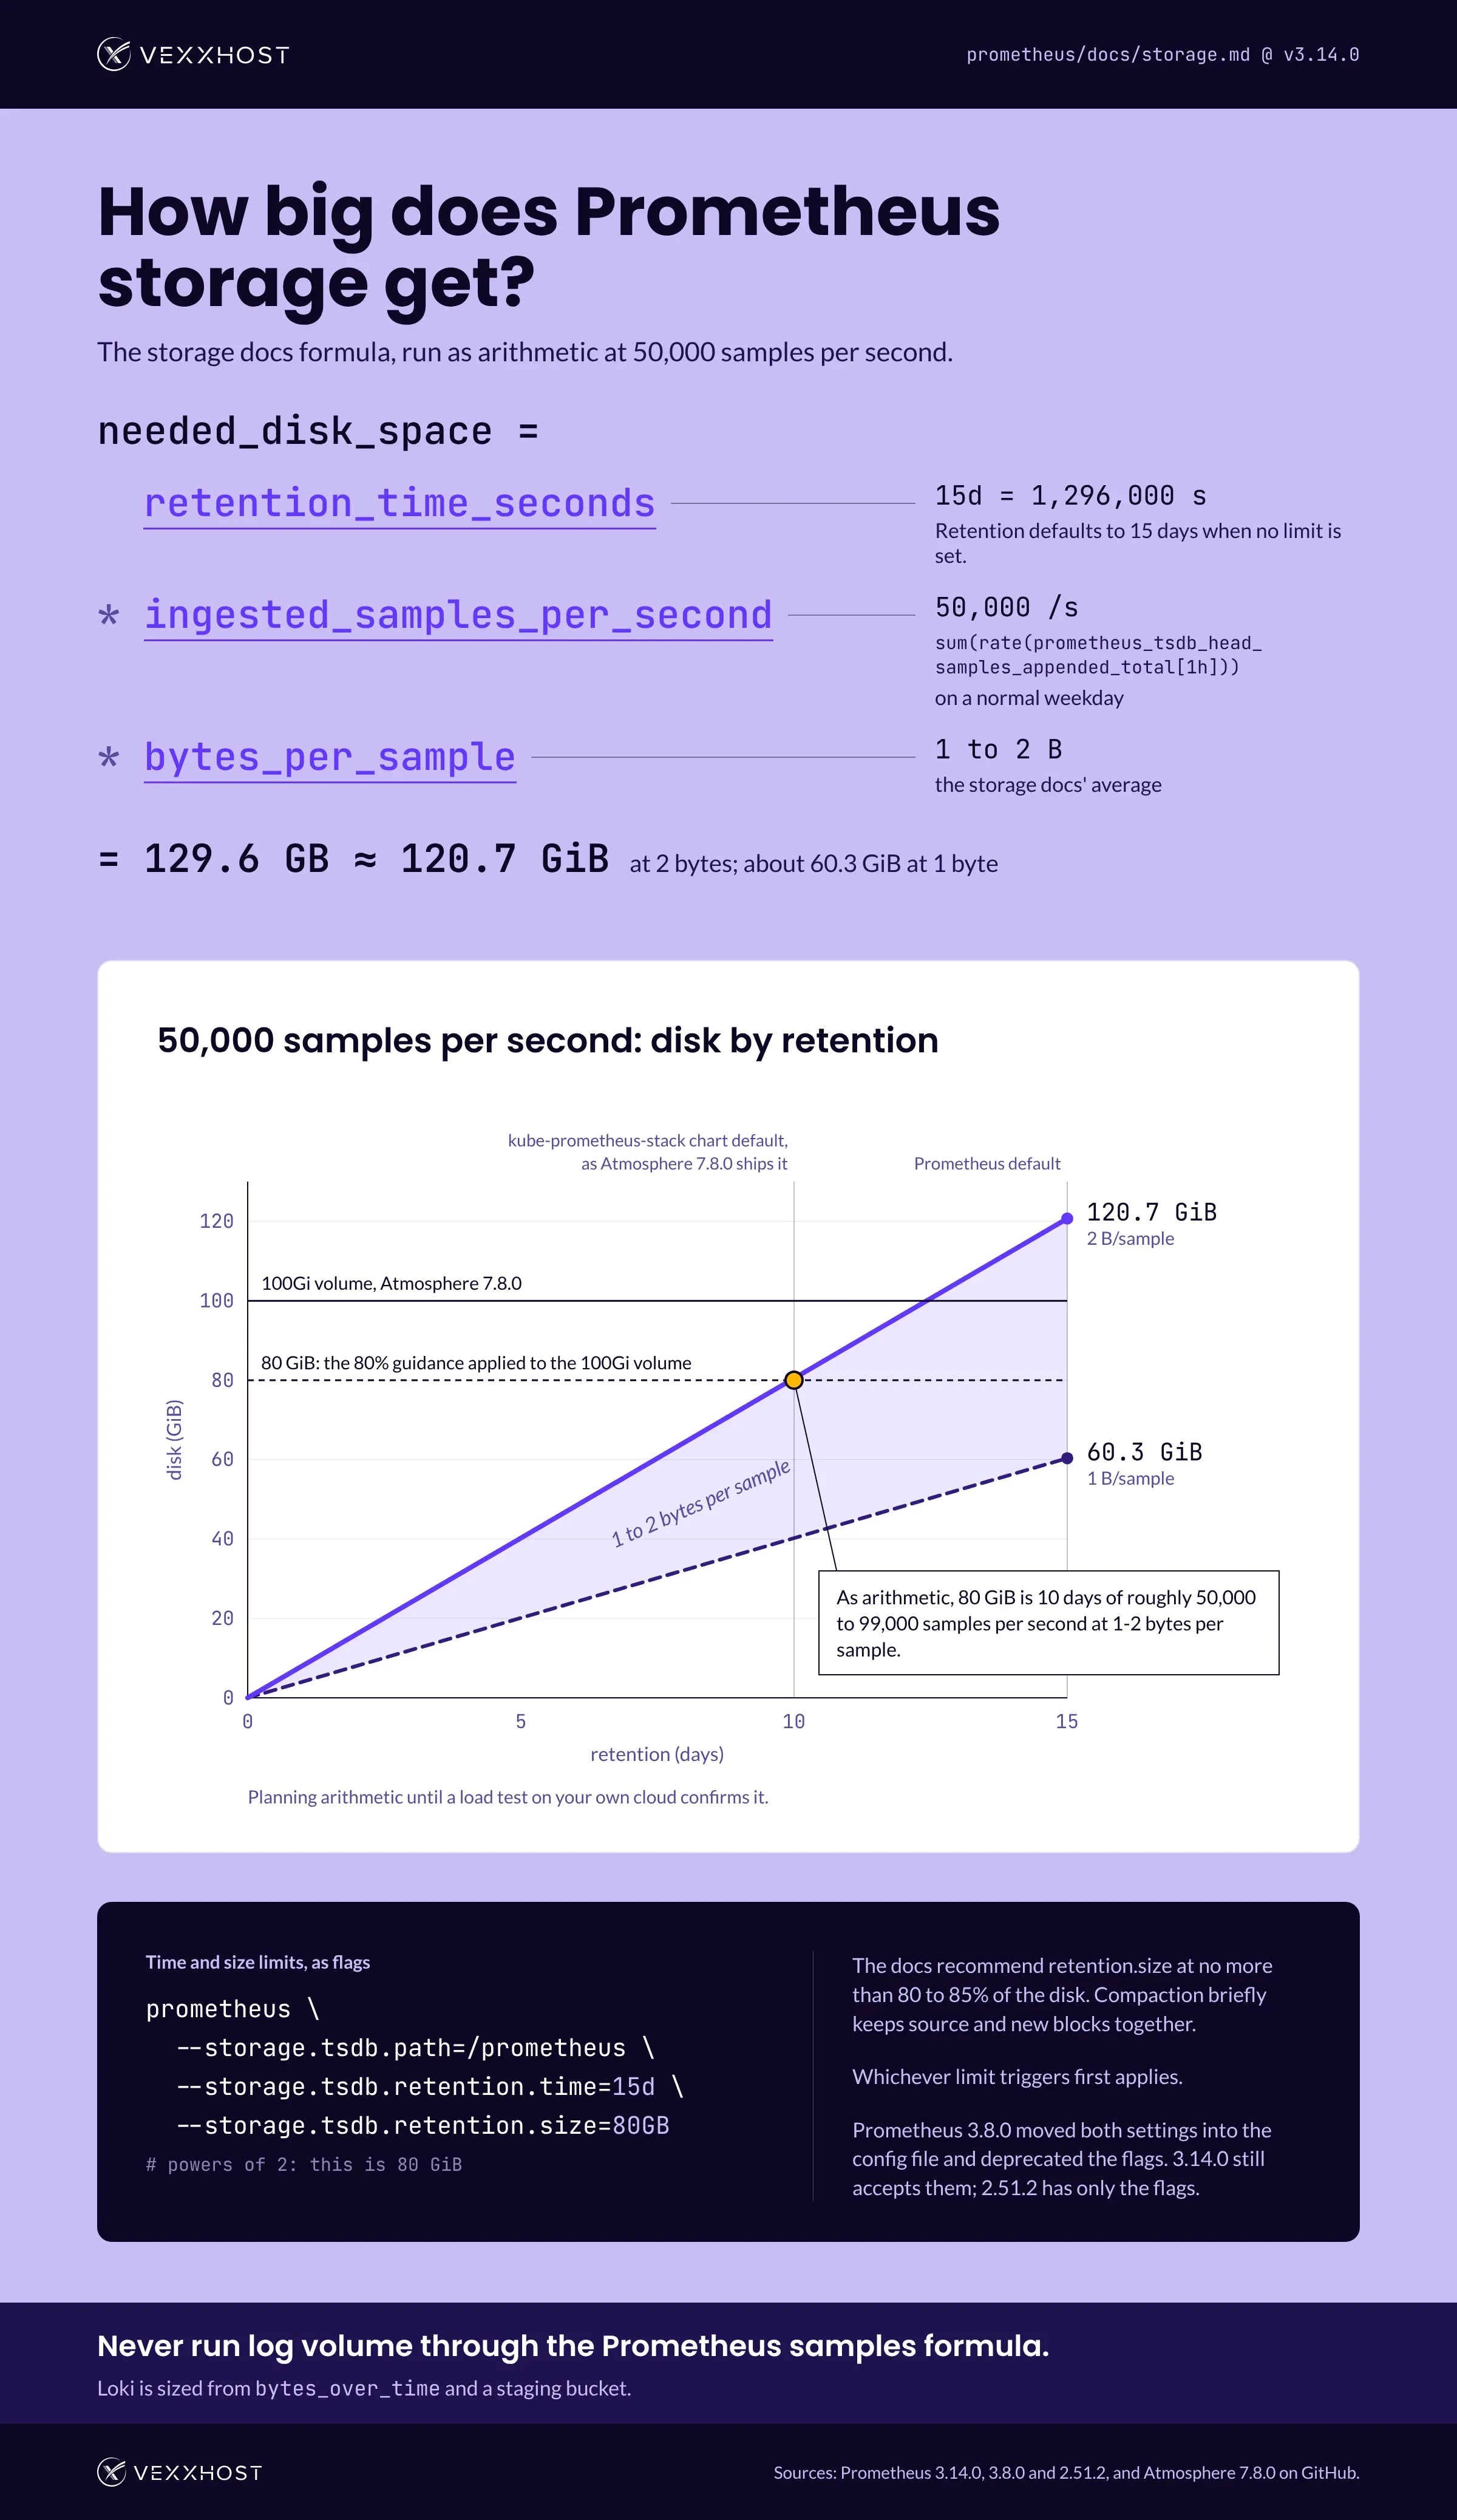
For disk, the storage docs give an average of "only 1-2 bytes per sample" and this formula:
needed_disk_space = retention_time_seconds * ingested_samples_per_second * bytes_per_sampleTake samples per second from the sum(rate(...)) query on a normal weekday. As arithmetic: 50,000 samples per second kept 15 days (1,296,000 seconds) at 2 bytes is 129.6 GB, about 120.7 GiB; at 1 byte, about 60.3 GiB. The docs recommend setting retention.size to at most 80-85% of the disk, since compaction briefly keeps source and new blocks together, and the size limit counts the WAL and m-mapped head chunks while deleting only persistent blocks. Retention defaults to 15 days when no limit is set, and whichever limit triggers first applies:
prometheus \
  --storage.tsdb.path=/prometheus \
  --storage.tsdb.retention.time=15d \
  --storage.tsdb.retention.size=80GB   # powers of 2: this is 80 GiB
Prometheus 3.8.0 moved these settings into the config file, under storage.tsdb.retention.time and .size, and marked the flags [DEPRECATED] (3.8.0 main.go); 3.14.0 still accepts them. Prometheus 2.51.2 has only the flags.
Atmosphere, the OpenStack platform we build at VEXXHOST, gives the formula a real volume to run against. It deploys infrastructure telemetry for the cloud itself, a stack we wrote about in February 2024. In 7.8.0 it installs the kube-prometheus-stack chart with Prometheus, Alertmanager, Grafana and alerting rules for its components. Prometheus gets a 100Gi volume (kube_prometheus_stack/vars/main.yml) and the chart's default 10-day retention with no size limit (values.yaml). The 7.8.0 pins are kube-prometheus-stack chart 60.2.0 (Chart.yaml), Prometheus 2.51.2, Alertmanager 0.27.0, Grafana 11.0.0, Loki 3.0.0 and Vector 0.38.0 (defaults/vars/main.yml). As arithmetic only, applying the 80% guidance to the 100Gi volume leaves 80 GiB, which at 1-2 bytes per sample is 10 days of roughly 50,000 to 99,000 samples per second. Treat it as planning arithmetic until a load test on your own cloud confirms it.
Loki needs its own measurement. Never run log volume through the Prometheus samples formula.
bytes_over_time counts the bytes each stream used over a range (metric queries), and in 3.7.7 its extractor returns len(line), the log line only (metrics_extraction.go). The per-tenant ingestion rate limit counts "the size of the logs line and the size of structured metadata labels" (limits.go), so treat the query result as a floor for ingested bytes.
A selector covers only streams that carry its labels. This range query returns a 24-hour total per namespace at each daily step, and skips any stream without a namespace label. The first point's window starts a day before the seven days requested, so before adding the points up, drop the first one, or replace since=7d with a start set one day after the beginning of the week you want and an end at the end of it:
curl -sG https://loki.example.internal/loki/api/v1/query_range \
  --data-urlencode 'query=sum by (namespace) (bytes_over_time({namespace=~".+"}[24h]))' \
  --data-urlencode 'since=7d' --data-urlencode 'step=24h'
Run a second query for whatever else ships logs, such as host journals, and add the totals. To see where the bytes come from inside one namespace, group by level. Loki 3.7.7 discovers levels at ingestion by default and stores them as the structured metadata key detected_level (levels.go); Loki 3.0.0 used level (3.0.0 limits.go).
sum by (detected_level) (bytes_over_time({namespace="payments"}[24h]))A service logging every request at INFO, or DEBUG left on in preview environments, fills your disks as surely as it fills a vendor invoice. Trim it before comparing platforms.
The 3.7.7 per-tenant defaults cap what Loki accepts:
limits_config:
  ingestion_rate_mb: 4               # per tenant; MB here means MiB
  ingestion_burst_size_mb: 6
  max_global_streams_per_user: 5000
  per_stream_rate_limit: 3MB
  retention_period: 0s               # keep forever; applies only with
                                     # compactor retention_enabled (default false)
At the default rate a tenant tops out at about 362 GB (337.5 GiB) a day. Rejected writes appear in loki_discarded_bytes_total by reason, including rate_limited, stream_limit and per_stream_rate_limit (validate.go).
For storage, measure on a staging install: send representative traffic to a fresh tenant, with retention longer than the test so nothing is deleted, and record the chunk and index bytes the bucket gains, together with the test's duration and the log bytes sent during it, so the reading can be scaled to production volume and to the retention you need. max_chunk_age defaults to 2h and controls age-based chunk flushing. Flush checks, queued work and retries can delay completed writes, so confirm the test data has been flushed before you measure its stored bytes. Scale that reading to production before it goes into the cost comparison, and repeat the test when log volume changes. If chunks go to Ceph RGW, the Loki S3 storage on Ceph RGW post covers placement, erasure coding and retention.
For comparison, Atmosphere 7.8.0 keeps its own Loki logs for 30 days, on a 256Gi volume, running in SingleBinary mode with filesystem storage (loki/vars/main.yml), and Vector ships Kubernetes and journald logs to it (vector/vars/main.yml).
Both keep blocks in a bucket you operate or rent; the Mimir README lists S3, GCS, Azure Blob Storage, OpenStack Swift and any S3-compatible store.
Thanos sits beside the Prometheus servers you already run. Its sidecar uploads each 2h block, which requires equal --storage.tsdb.min-block-duration and max-block-duration (2h recommended), and Thanos recommends at least 6h of local retention. The compactor must run as a singleton against a bucket, creates 5m downsampled blocks after 40 hours and 1h blocks after 10 days, and keeps each resolution forever unless --retention.resolution-raw, -5m and -1h are set.
Mimir receives Prometheus remote_write, so each Prometheus can keep short local retention. Per-tenant defaults are 150,000 in-memory series before replication (max_global_series_per_user) and 10,000 samples per second (ingestion_rate), with deletion set by compactor_blocks_retention_period (limits.go). Mimir's docs call the Kafka-based ingest storage architecture "stable and the preferred architecture" from 3.0 (ingest storage), while ingest-storage.enabled still defaults to false in 3.2.0 (config.go). This post assumes the classic architecture; ingest storage adds a Kafka-compatible system to run.
Choose Thanos when a few Prometheus servers stay the write path and you want history behind them. Choose Mimir when several teams share one store and need separate limits. Add up prometheus_tsdb_head_series across every Prometheus that would write to one Mimir tenant to see whether the 150,000 default needs raising on day one.
The Atmosphere Prometheus and Loki described here provide infrastructure telemetry for the cloud. Designing application observability requires additional decisions about instrumentation, collection, retention and operation. Atmosphere 7.8.0 deploys no long-term metrics store and no trace backend, so Thanos or Mimir, Tempo, and the collectors in your workloads remain yours to design, size and run.
The example below forwards OTLP from applications on the same host to a backend, with a queue on disk. The OTLP receiver's gRPC endpoint defaults to localhost:4317 in 0.159.0 (otlpreceiver), so remote senders need an explicit endpoint, and reading node log files needs a separate log source. An exporter's sending_queue is on by default, holds 1,000 requests in memory, and drops data it cannot enqueue; a storage extension makes it persistent (exporterhelper). The memory_limiter processor is recommended first in each pipeline (memory_limiter).
receivers:
  otlp:
    protocols:
      grpc:                      # listens on localhost:4317 by default
processors:
  memory_limiter:
    check_interval: 1s
    limit_percentage: 80
    spike_limit_percentage: 15
extensions:
  file_storage/otc:              # contrib or k8s distribution
    directory: /var/lib/otelcol/file_storage   # must already exist
exporters:
  otlp_http:                     # "otlphttp" is the deprecated alias in 0.159.0
    endpoint: https://otlp.example.internal
    sending_queue:
      storage: file_storage/otc  # persistent queue, 1,000 batches by default
service:
  extensions: [file_storage/otc]
  pipelines:
    logs:
      receivers: [otlp]
      processors: [memory_limiter]
      exporters: [otlp_http]
Test it before trusting it: block the backend, restart the collector, restore the backend, and confirm the queued batches arrive. The file storage extension needs read and write access to that directory.
A dead monitoring stack sends no alert about its own failure. The usual pattern is an alert that always fires, sent to an external dead-man's-switch service that pages when it stops arriving. Deliver it through a path that does not depend on the stack it watches. Deciding which of the cloud's other alerts deserve a page at all is the subject of the guide to OpenStack monitoring tools, metrics and alert fatigue.
Upgrades and recovery are the other standing commitment. Each component has its own release train: Prometheus deprecated its retention flags in 3.8.0, and Collector 0.159.0 lists the HTTP exporter as otlp_http with otlphttp as a deprecated alias (metadata). Read release notes for every hop, and rehearse a Prometheus restore from a snapshot, which the storage docs recommend for backups.
Price the self-operated stack and every vendor quote at the same retention and availability. For the self-operated stack, count:
Vendor billing units can differ from these measurements, so convert before you compare. Run sum(rate(prometheus_tsdb_head_samples_appended_total[1h])) and prometheus_tsdb_head_series against each production Prometheus you are sizing, and the week-long bytes_over_time range query against production Loki. Put samples per second and the retention you need into the Prometheus disk formula, take the Loki storage figure from the staging tenant, and keep the two results separate. Restate the samples, series and daily log bytes in the units of a vendor quote at the same retention and availability, and set that quote against the four cost lines for the self-operated stack.
Choose from Atmosphere Cloud, Hosted, or On-Premise.
Simplify your cloud operations with our intuitive dashboard.
Run it yourself, tap our expert support, or opt for full remote operations.
Leverage Terraform, Ansible or APIs directly powered by OpenStack & Kubernetes