

Kubernetes
SaaS Infrastructure: Shared Kubernetes, Clusters or VMs?
Compare shared Kubernetes, tenant namespaces, dedicated clusters, and VMs for SaaS infrastructure. Learn how isolation, costs, and operations shape your choice.
Read field noteField notes / Latest
Engineering notes from operating open infrastructure: the failures, design decisions, and upstream work that make open infrastructure better.
Browse all field notesCompare shared Kubernetes, tenant namespaces, dedicated clusters, and VMs for SaaS infrastructure. Learn how isolation, costs, and operations shape your choice.
Read field note
Learn why backups alone don't guarantee recovery and how RTO, RPO, infrastructure dependencies, and recovery testing improve disaster readiness.
Read field note
Compare private AI inference, managed endpoints, and public AI APIs. Learn when data control, latency, model flexibility, and cost justify a change.
Read field note
Learn why cloud workloads stay slow despite normal CPU and RAM, and how to diagnose storage, network, VM, load-balancer, and shared-resource bottlenecks.
When an application slows down, CPU and memory are usually the first places teams look. If utilization is high, the response is often to add vCPUs or RAM. If both metrics look normal, troubleshooting can stall.
Application performance depends on more than compute capacity. A request may pass through a load balancer, several services, a database, storage, and multiple network paths before a user receives a response. Delay at any point can make the entire application feel slow.
Cloud performance bottlenecks are constraints in storage, networking, load balancing, VM configuration, host scheduling, or shared infrastructure that delay workloads even when CPU and memory appear available. Finding the real constraint requires teams to correlate application symptoms with infrastructure metrics across the full request path.
CPU utilization is visible and familiar, which makes it a convenient suspect, but not always the correct one.
Consider a database-backed application with CPU usage below 40%. During slow transactions, storage write latency and queue depth rise sharply. The application is not waiting for more compute; it is waiting for storage acknowledgements. Adding vCPUs would increase cost without removing the delay.
A service can also have idle CPU while waiting for another service, a congested network path, or an overloaded load balancer. Effective troubleshooting therefore begins with a better question:
What resource is the workload waiting for?
Storage performance is not a single measurement. Teams need to understand three related limits.
Input/output operations per second measure how many storage requests can be completed. Databases and VMs often generate many small, random operations, making IOPS an important constraint.
Latency measures how long each storage operation takes. For interactive and database workloads, rising read or write latency can affect response times before storage reaches its maximum throughput.
Throughput measures the volume of data transferred over time. Backups, analytics jobs, and large sequential reads may reach a throughput limit even when IOPS remain moderate.
Workload shape matters. Random writes behave differently from sequential reads, and averages can hide slow outliers. Review read and write latency separately, along with queue depth, throughput, and tail latency.
A storage bottleneck is likely when application latency rises with storage latency or queue depth. High operating-system I/O wait is a useful clue, but it should be correlated with volume and backend metrics rather than treated as proof.
Distributed architectures turn network performance into application performance. Requests may travel between VMs, Kubernetes services, databases, storage systems, availability zones, or external users.
Bandwidth alone does not explain network performance. Round-trip time, packet loss, retransmissions, packets-per-second pressure, MTU inconsistencies, and routing can all create delays that CPU graphs will not reveal.
Separate east-west traffic between internal services from north-south traffic entering or leaving the environment to identify where the delay occurs.
For example, an API may respond normally inside a Kubernetes cluster but slow down through an external endpoint. Comparing backend processing time with total request latency can reveal whether the delay occurs in the application, network path, or load-balancing layer.
Monitor round-trip latency, packet loss, retransmissions, bandwidth, dropped packets, and p95 or p99 request latency, not bandwidth alone.
A load balancer improves availability only when it has enough capacity and is configured for the workload.
Connection limits, uneven request distribution, aggressive health checks, session persistence, TLS termination, and slow backends can all affect performance. Monitoring only whether backend instances are “healthy” misses much of the picture.
Track active and queued connections, TLS handshake time, backend latency, health-check failures, request distribution, and 502 or 503 responses. Compare load-balancer time with application processing time. Adding instances will not help if the load-balancing tier remains the limiting resource.
Right-sizing is not simply a choice between a small and a large VM. The correct size depends on how the workload consumes CPU, memory, storage, and network resources.
An undersized VM may experience swapping, throttling, long queues, out-of-memory events, or constant autoscaling pressure. An oversized VM wastes capacity and may reduce scheduling flexibility, especially when large instances must align with host NUMA topology.
Ask:
Review sizing regularly because traffic and architecture change.
Cloud platforms often allocate more virtual CPUs than physical cores because most workloads do not peak simultaneously. Used carefully, overcommit improves utilization. Used too aggressively, it creates scheduling contention.
A VM can report moderate CPU utilization while its vCPUs still wait for physical cores. Symptoms may include CPU steal time, longer guest run queues, inconsistent latency, and degradation during busy periods.
This differs from a workload that simply needs more CPU. The question is not only how much CPU the guest consumes, but how consistently the host can schedule it.
Latency-sensitive workloads may require dedicated CPUs, CPU pinning, or NUMA-aware placement. OpenStack Nova provides CPU topology, pinning, and NUMA controls that can reduce latency and improve predictability for suitable workloads.
A noisy neighbor is another workload competing for the same underlying resource. It may consume storage IOPS, network bandwidth, cache capacity, or physical CPU time and create variability for nearby workloads.
The key symptom is inconsistency. Performance worsens even though the affected application's own demand has not changed. Guest metrics may look normal while host, storage, or network metrics show contention elsewhere.
Before blaming a noisy neighbor, rule out persistent capacity shortages and application changes. Then correlate performance drops with shared-resource saturation. Migration, placement policies, quality-of-service controls, or stronger isolation can help.
Shared infrastructure suits many workloads. Applications with strict latency or isolation requirements may benefit from a Hosted Private Cloud or another dedicated design with greater control over placement and resource boundaries.
A useful monitoring strategy connects user-facing symptoms to the supporting infrastructure. Google’s Site Reliability Engineering guidance recommends focusing on latency, traffic, errors, and saturation; the signals most closely connected to service behavior.
For cloud environments, correlate:
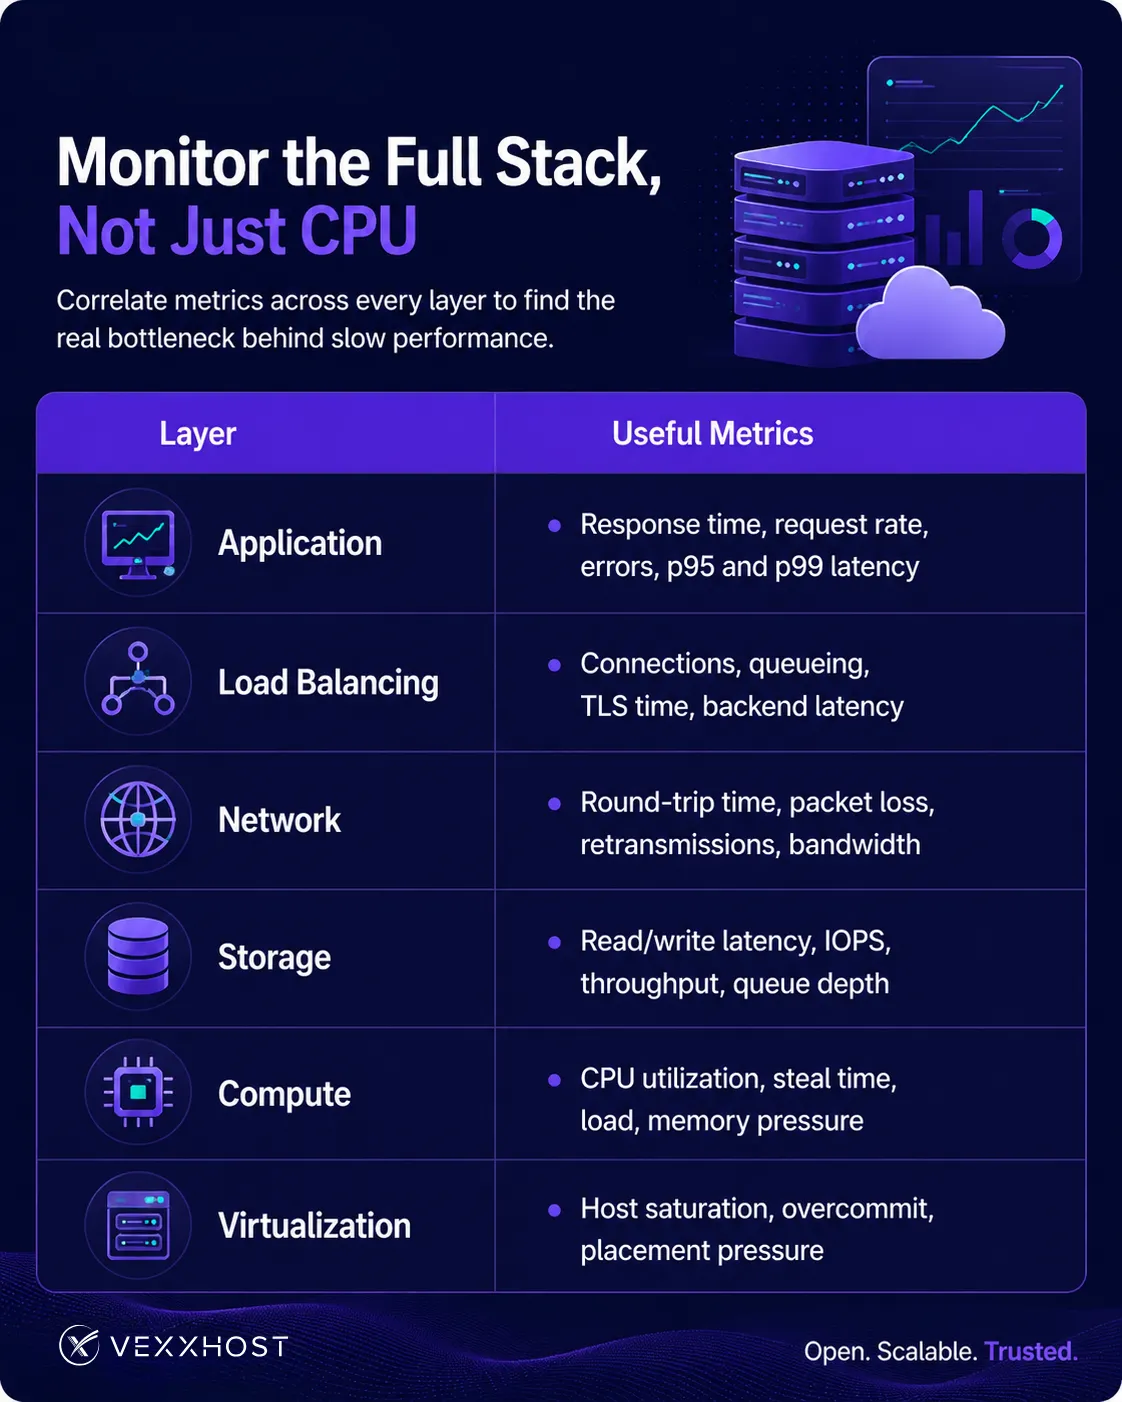
Managed Kubernetes environments need the same cross-layer view. Pod and node metrics should be interpreted alongside ingress, networking, persistent-volume, and underlying infrastructure performance.
Before increasing instance size or adding capacity:
Build observability into every layer so teams can trace a slow request to the supporting infrastructure. Review tail latency rather than averages alone.
Use workload-aware placement and sizing. Keep latency-sensitive services separate from unpredictable batch workloads, and select storage and network designs that match actual I/O patterns.
Test realistic load conditions. Benchmarks should reflect production request sizes, concurrency, data-access patterns, and dependencies. A component performing well alone may behave differently once it shares resources or participates in a distributed request path.
Treat performance as a balance across compute, storage, networking, and application design. Increasing one resource cannot compensate indefinitely for a bottleneck elsewhere.
When a cloud workload is slow, more CPU and RAM may help, but only when compute capacity is the actual constraint.
Storage latency, network behavior, load-balancer limits, VM configuration, host contention, and noisy neighbors can produce the same visible symptom. Teams that monitor the whole request path can identify these problems faster, avoid unnecessary scaling, and design more predictable infrastructure.
VEXXHOST supports organizations across this lifecycle: testing and scaling workloads on OpenStack Public Cloud, creating stronger isolation with Hosted Private Cloud, operating distributed applications through Managed Kubernetes, and reviewing complex architectures through Infrastructure Consulting.
The logical next step is not always to add resources. It is to understand what the workload is waiting for and design the infrastructure around the answer. Contact us!
Choose from Atmosphere Cloud, Hosted, or On-Premise.
Simplify your cloud operations with our intuitive dashboard.
Run it yourself, tap our expert support, or opt for full remote operations.
Leverage Terraform, Ansible or APIs directly powered by OpenStack & Kubernetes