


Prometheus is an open source monitoring system and time series database. It addresses many aspects of monitoring such as the generation and collection of metrics, graphing the resulting data on dashboards, and alerting on anomalies. The main features of Prometheus is that its a multi-dimensional data model with a flexible query language to leverage this dimensionality. So, this will allow you to not only easily fine tune the definitions of the Prometheus metrics, but also generate more accurate reports. The Prometheus ecosystem consists of multiple components that are are written in Go language, making them easy to build and deploy as static binaries.
In this tutorial we will cover the installation of Prometheus and its usage to monitor the CentOS 7 server by following the steps as shown below.
System Update
Connect to the CentOS 7 base operating system using the non-root sudo user and run the command as shown below to update your server with the latest updates and missing patches.
$ sudo yum update
Make sure that you have sufficient disk space to install the update, then type ‘y’ and hit ‘Enter’ to continue.
Downloading Prometheus
Once your server is ready with all of the updates, proceed to the installation setup of Prometheus. To do so, first we will download its latest available package on Github. We will be using the ‘Curl’ command to download Pometheus in a newly created directory using the following commands.
$ mkdir backup
$ cd backup
$ curl -LO "https://github.com/prometheus/prometheus/releases/download/0.16.0/prometheus-0.16.0.linux-amd64.tar.gz"
Prometheus Installation
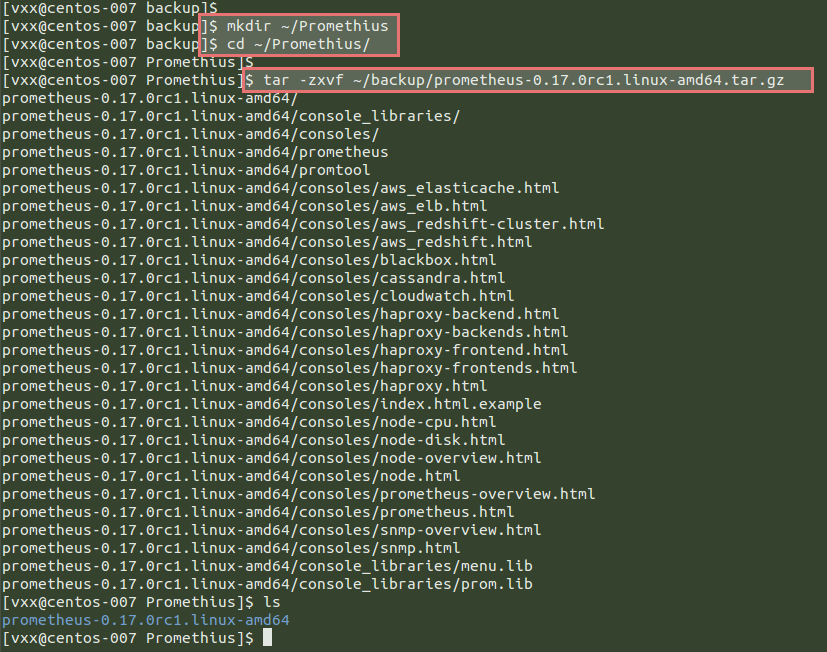
We will be creating a new directory to install Prometheus into as it would be best practise to keep all the components of Prometheus within one parent directory. So, run the commands below to create a new directory in the home directory of your current user and extract the Prometheus package on it.
$ mkdir ~/Prometheus
$ cd ~/Prometheus
$ tar -zxvf ~/backup/prometheus-0.17.0rc1.linux-amd64.tar.gz
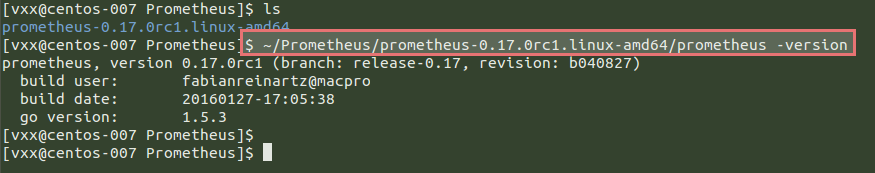
Now run the following command to verify the installation and check the version of ‘Prometheus’ and ‘Go’ installers.
$ ~/Prometheus/prometheus-0.17.0rc1.linux-amd64/prometheus -version
Installation of Node Exporter
Node Exporter is actually the Prometheus exporter for machine metrics, written in Go with pluggable metric collectors that exports a lot of metrics such as disk I/O statistics, memory usage, network statistics, CPU load and much more in a format that Prometheus recognizes.
The installation package for Node Exporter is also available on Github that can be downloaded from the Prometheus Node Exporter releases. Copy the Source link address to download the package using the ‘Curl’ command.
$ cd ~/backup/
$ curl -LO "https://github.com/prometheus/node_exporter/releases/download/0.12.0rc3/node_exporter-0.12.0rc3.linux-amd64.tar.gz"

Then extract this using the ‘tar’ command in a new directory ‘node_exporter’ under Prometheus using the following commands.
$ mkdir ~/Prometheus/node_exporter
$ cd ~/Prometheus/node_exporter/
$ tar -zxvf ~/backup/node_exporter-0.12.0rc3.linux-amd64.tar.gz

Starting Node Exporter
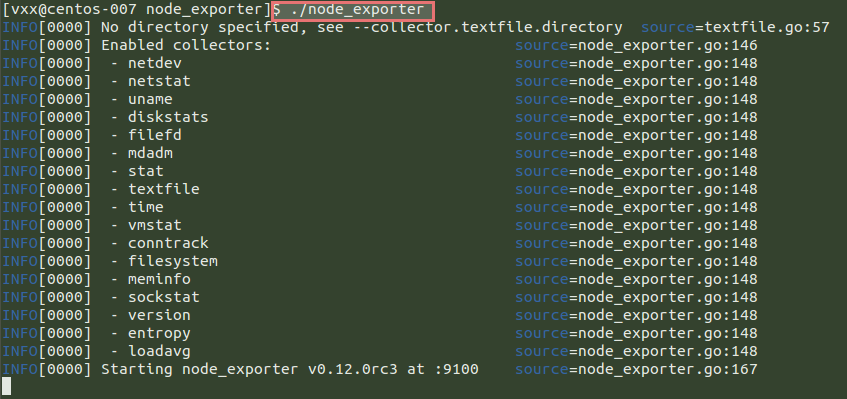
Execute the node_exporter within the same directory where extracted, to run its service as shown below.
$ ./node_exporter
Node Exporter As a Service
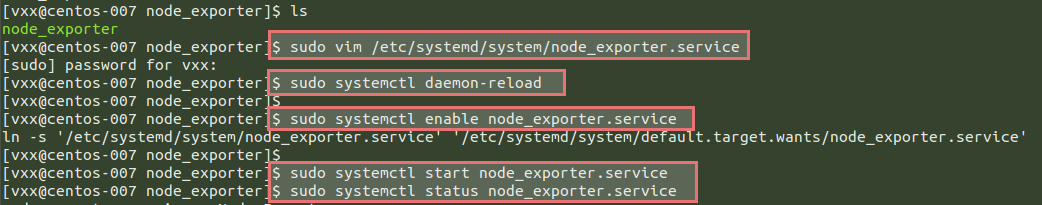
Node Exporter has been placed under the home directory of our sudo user in ‘~/Prometheus/node_exporter’ directory. Now we are going to configure it as a service so that we can easily start and stop Node Exporter service when required.
$ sudo vim /etc/systemd/system/node_exporter.service
[Unit]
Description=Node Exporter [Service] User=vxx ExecStart=/home/vxx/Prometheus/node_exporter/node_exporter [Install] WantedBy=default.target
Then start the service after reloading daemon or reboot the server.
$ sudo systemctl daemon-reload
$ sudo systemctl enable node_exporter.service
$ sudo systemctl start node_exporter.service
$ sudo systemctl status node_exporter.service
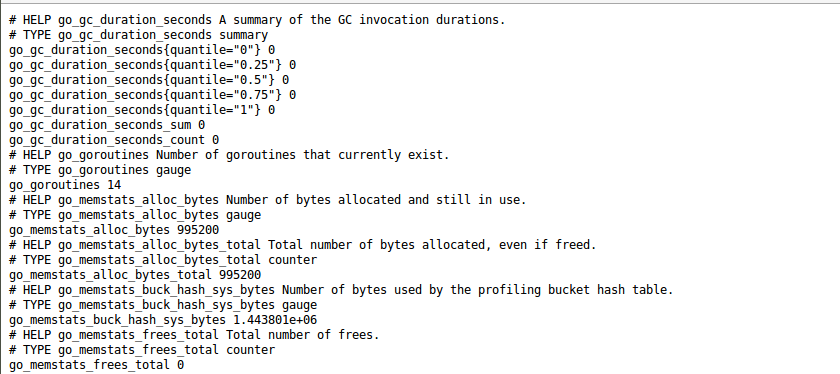
Once the node_exporter service is running, open your browser to view Node Exporter’s web interface by following the link below.
http://your_servers_ip:9100/metrics
Starting Prometheus Server
We are now ready to start the Prometheus server by creating a new configuration file in the Prometheus directory with the following code in it.
$ cd ~/Prometheus/prometheus-0.17.0rc1.linux-amd64/
$ vim prometheus.yml
scrape_configs:
- job_name: "node"
scrape_interval: "15s"
target_groups:
- targets: ['localhost:9100']
Close after making saving the changes using ‘:wq!’.
These configurations will create the ‘scrape_configs’ and a ‘job_name’ as ‘node’ that can be any name you wish. Then start the Prometheus server as a background process and redirect it to output the log files using the following command.
$ nohup ./prometheus > prometheus.log 2>&1 &
To view these logs you can use the command below.
$ tail ~/Prometheus/prometheus-0.17.0rc1.linux-amd64/prometheus.log

Prometheus Web Access
Now open your favourite web browser to access the Prometheus web console using your server’s IP address or FQDN as shown below.
http://your_servers_ip:9090

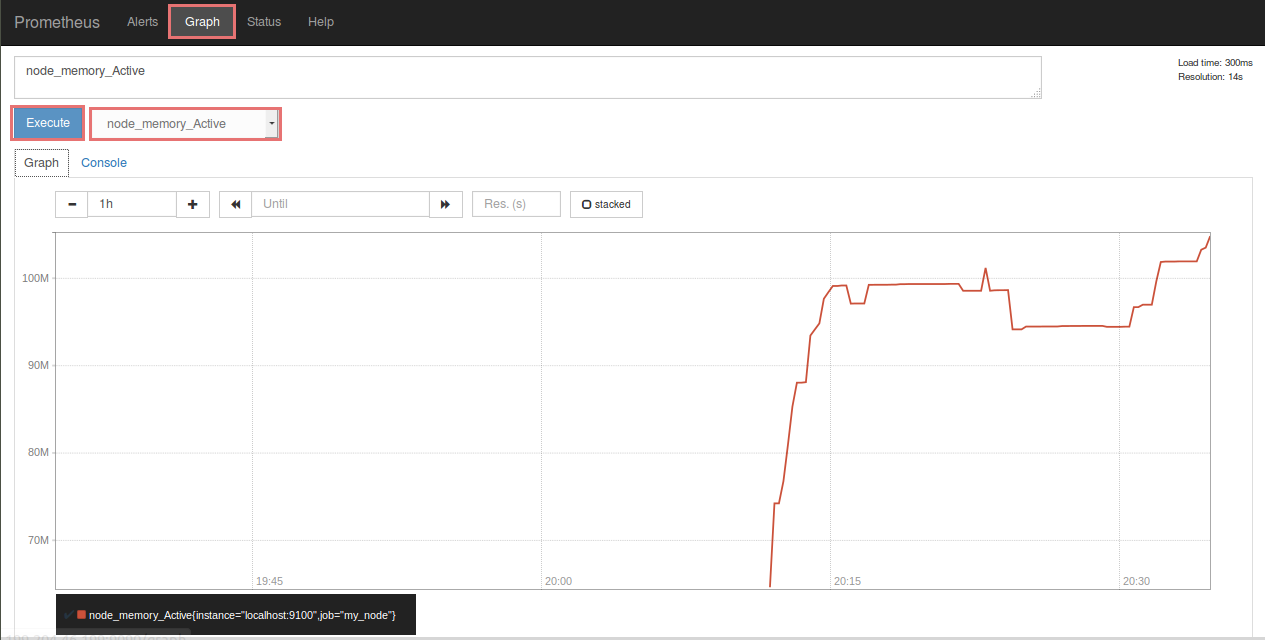
To make sure that the Prometheus server is fetching the data from the Node Exporter, click on the Graph and insert any metric chosen from the drop down, then click on the ‘Execute’ button to see the graph as shown below.
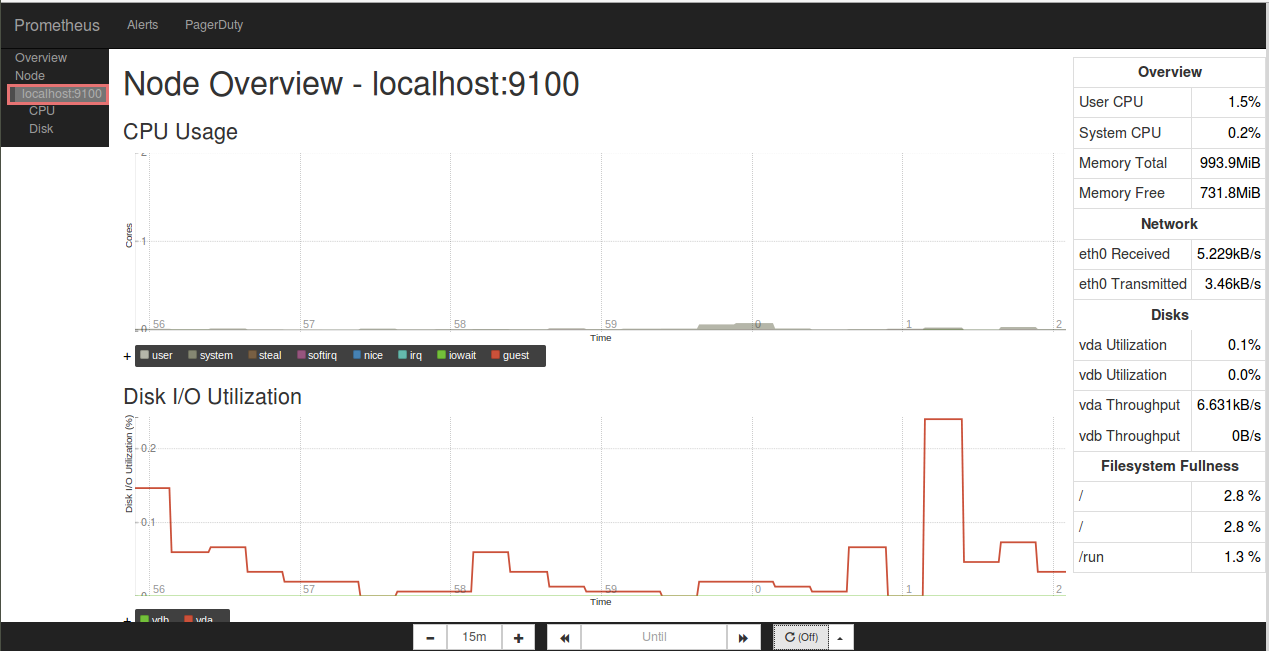
You can view the most commonly used metrics from the console templates that are available under the following path.
$ ls ~/Prometheus/prometheus-0.17.0rc1.linux-amd64/consoles
http://yourservers_ip:9090/consoles/node.html
PromDash Installation
PromDash is a tool that allows to create custom dashboards which are not only highly configurable but also better-looking. It is generally used for debugging purposes or to run one-off queries.
So this is the preferred way to visualize the data in Prometheus’ time-series database by using PromDash.
To download and run PromoDash, you need to install some of its required packages like Git, Ruby and a few build tools by executing the following ‘Yum’ command.
$ sudo yum install git ruby ruby-devel gcc gcc-c++ sqlite-devel zlib-devel patch automake
Type ‘y’ and hit Enter key to proceed with the installation including its dependent packages. Once the installation is completed run the command below to clone git repository of the PromoDash package.
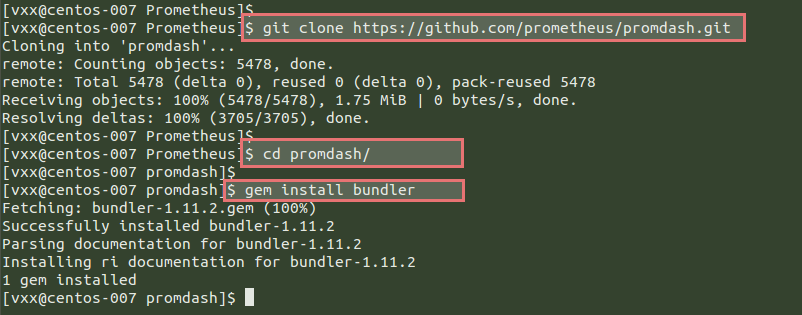
$ git clone https://github.com/prometheus/promdash.git
Now run the command below to install the Gem know as bundler required by PromoDash for installing the Ruby gems.
$ cd promdash/
$ gem install bundler
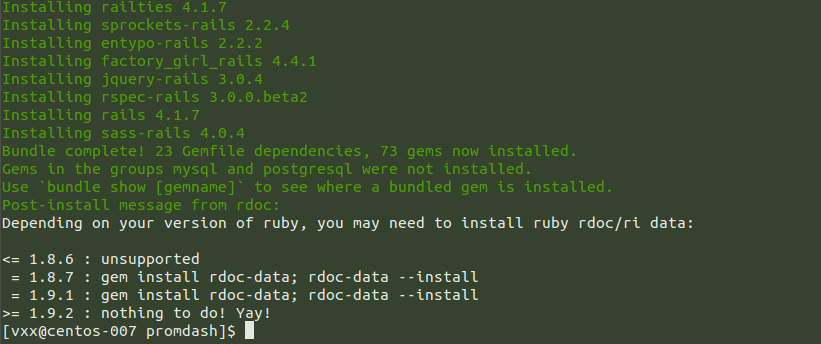
Then run the ‘Bundle’ command to install all the Ruby gems that PromDash requires. The installation process might take some time to complete and you will get the following output after installation.
$ bundle install --without mysql postgresql
Setup the Rail Environment
PromDash uses an environment variable called the ‘DATABASE_URL’ to determine the name of the the database associated with it. In the database directory, we will provide the Database server what it is going to use here followed by the command to setup the RAIL environment for production use and redirect it out to the ‘Bashrc’ file.
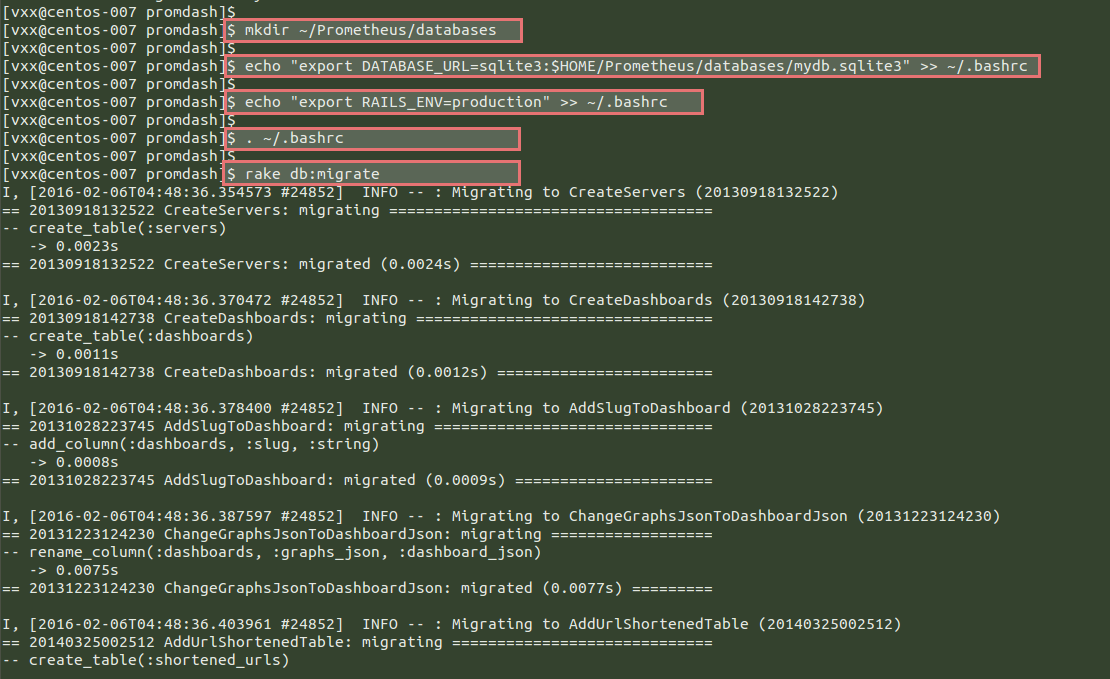
Let’s run the following commands to configure the Rails Environment as shown.
$ mkdir ~/Prometheus/databases
$ echo "export DATABASE_URL=sqlite3:$HOME/Prometheus/databases/mydb.sqlite3" >> ~/.bashrc
$ echo "export RAILS_ENV=production" >> ~/.bashrc
$ . ~/.bashrc
After updating the Bashrc file run the following command with ‘rake’ tool to create PromDash’s tables in the SQLite3 database.
$ rake db:migrate
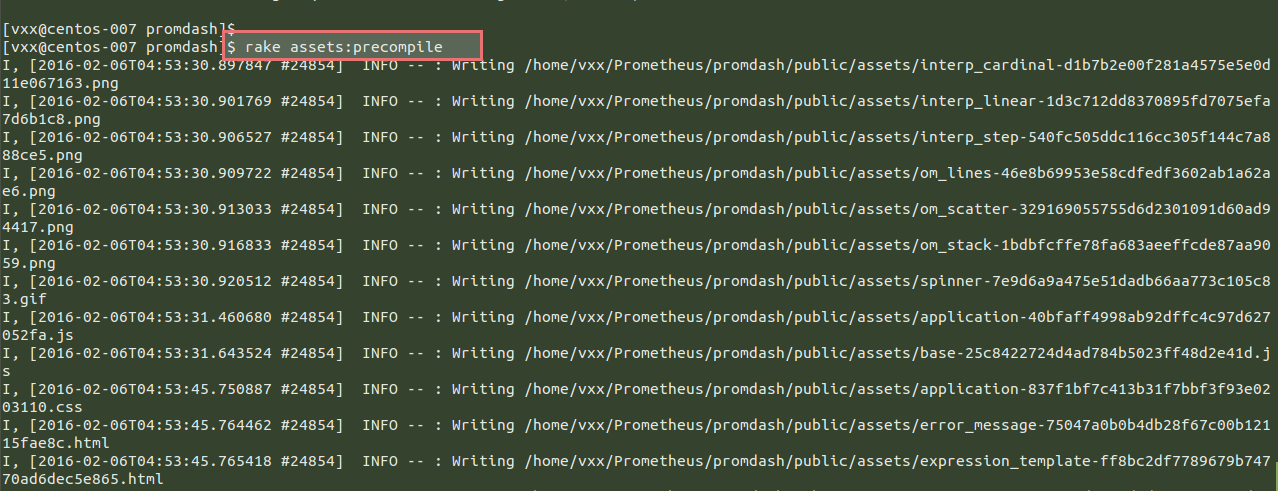
Run the command below to recompile PromDash project because it uses the Rails Asset Pipeline, so all the assets including Javascript files, CSS files and images should be recompiled using the rake tool command as shown.
$ rake assets:precompile
Starting PromoDash
Run the following command to start the PromoDash server’s service under Thin (a light weight server) .
$ bundle exec thin start -d
Then open your web browser to access the PromoDash web console using the following link.
http://your_servers_ip:3000/
Adding Server and New Dashboard
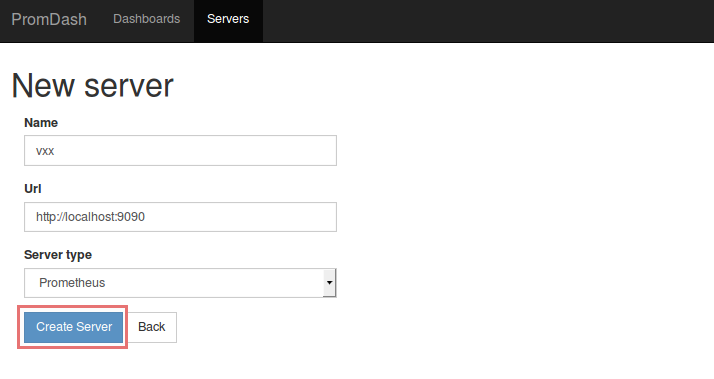
In order to create a new server and dashboard using PromoDash, click on the server’s tab as shown below and give your user’s name and its URL to access with port ‘9090’ and click on the ‘Create Server’ button.
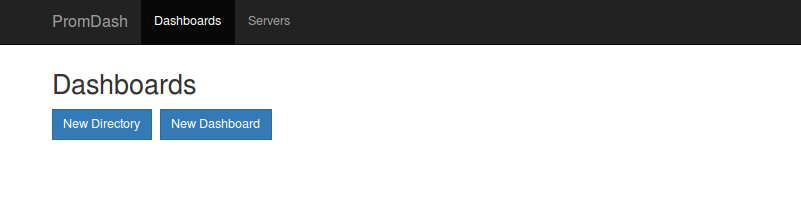
Then proceed to the next tab under Dashboards, give it a new name on New Dashboard and click on the ‘Create Dashboard’ button and that’s it.

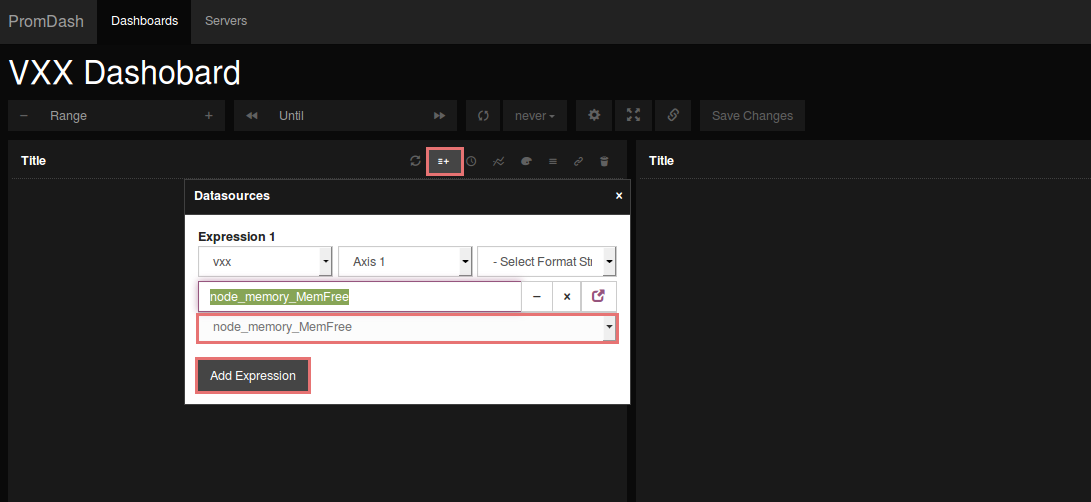
Once you have created your server and new dashboard, you can now add multiple data sources to view the graphs containing your required information by choosing the expressions from the drop down table as shown.
Conclusion
Prometheus is a next generation monitoring system for your HAProxys, application performance and for alerting on your batch jobs. The power of the query language and multi-dimensional metrics allows to increase alerting coverage, decrease false positives, and reduce the amount of operational work required to maintain monitoring. So, we hope you will enjoy your time using Prometheus and do not hesitate to share your thought about this great tool.
Would you like to know about Zuul, a CI/CD project gating tool? Download our white paper and get reading!